

- Home
- All modules
- Visitors & reports
- Your own figures in client reports
Visitors & reports
Your own figures in client reports
Calls, sales, ad spend: bring in any figures from a CSV file or a Google Sheet
Put your own figures in client reports: figures we have no connection for. Upload a CSV file or read a Google Sheet; the figures show in reports, the KPI board and the client portal like any others.
Illustration of the screen, without data.
Why it matters
From the problem to what SEOmise does
The figures clients care about live somewhere else
Calls from a call-tracking tool, sales from the till, ad spend from a spreadsheet: without them a report shows search work but not what it brought in.
Calls, sales, ad spend: bring in any figures from a CSV file or a Google Sheet
- On the KPI board. Calls, leads, sales, revenue and ad spend for the last 30 days (a setting), with the change.
- In the client portal. Reports with your figures can be shared to the portal and by link like any report.
- Google Sheets. Read a sheet again whenever it changes; only read-only access is asked for.
How it works
Three steps, start to finish
- Bring them inA CSV file with a date column and one column per figure, or a Google Sheet read with read-only access.
- Check the columnsEvery row and number is checked first; problems name the row and the column. Say what each column counts.
- Report on themYour own figures as a report of its own and as a part of the monthly client pack, against the period before.
Features
What you get with Your own figures in client reports
On the KPI board
Calls, leads, sales, revenue and ad spend for the last 30 days (a setting), with the change.
In the client portal
Reports with your figures can be shared to the portal and by link like any report.
Google Sheets
Read a sheet again whenever it changes; only read-only access is asked for.
Checked and safe
Only dates and numbers are kept; names are plain text, and spreadsheet formulas are neutralised in exports.
What it needs
No surprises after you sign up
Turn a card over for the detail.
The Reports centre
The Reports centre
Part of the Reports centre, in a project's Reports.
Where Your own figures in client reports is included
Included in these plans. Limits, such as pages per scan or credits a month, are on the pricing page.
See pricingNot sure it fits?
Ask Mise, our assistant, in the help centre, or book a call and we will show you Your own figures in client reports on a site like yours.
Questions
Your own figures in client reports: common questions
What should the file look like?
The first row names the columns. The first column holds dates such as 2026-10-31 (or 2026-10 for a month); each other column is one figure. Size, row and column limits are shown on the upload.
Does it change my Google Sheet?
No. Only read-only access is asked for, and only the range you choose is read.
Which plans include Your own figures in client reports?
Your own figures in client reports is included in the Free, Personal, Business and Agency plans. Prices and limits are on the pricing page.
Guides
Your own figures in client reports: how-to guides
Works well with
Related modules
-
Reports centre
An SEO reporting tool: every report in one gallery, as a branded PDF or a link
Explore -
Live client report links
Live SEO reports: send clients one private link that is always up to date
Explore -
Free report switch-over
Moving from another reporting tool? We rebuild your client reports for free
Explore -
Agency tools
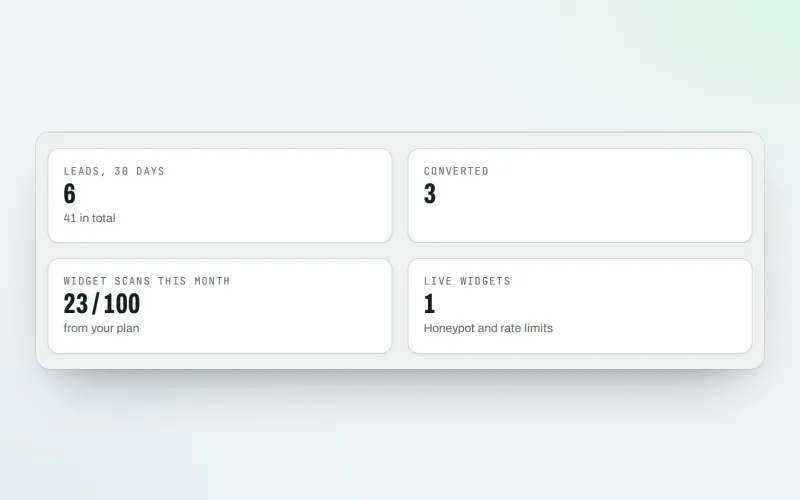
SEO agency software: win clients, work under your brand, give each client a portal
Explore -
SEO audit reports
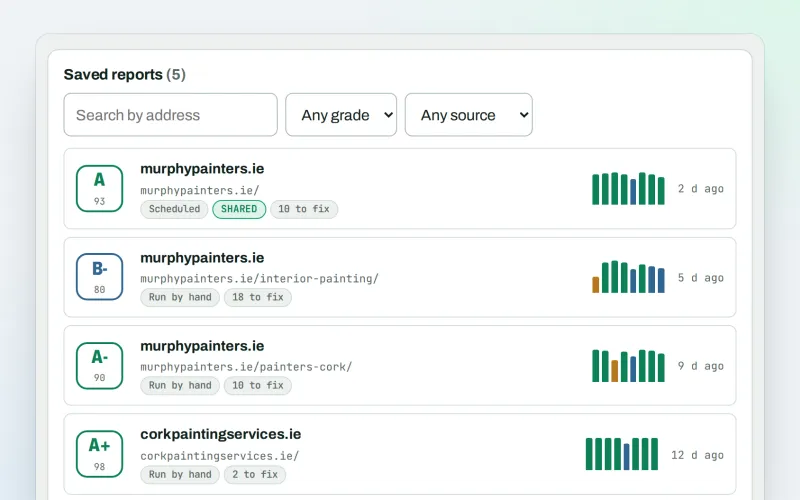
A graded SEO audit of any web address, ready to share or send
Explore -
Client update e-mails
Client SEO updates by e-mail: rankings up, rankings down and the work done
Explore -
Google data
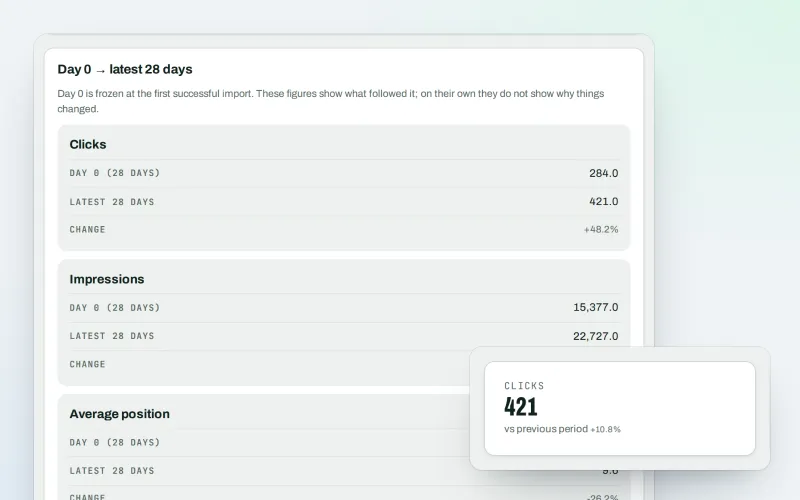
A Search Console dashboard with your Analytics figures, imported every day
Explore -
Live view
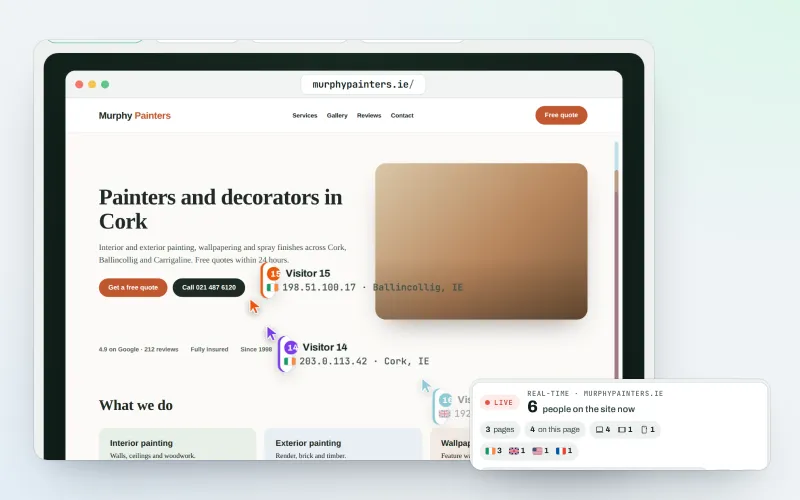
See real-time website visitors, right now, and where they click
Explore
Try Your own figures in client reports on your own site
Add your site; your first scan becomes your Day 0 baseline. Nothing is bought or published without your approval.
No ranking guarantees: just clear work, with the evidence.
